 Amber Naz
Quick Summary
If you’ve searched for the average conversion rate of a Shopify website, you’ve probably found answers anywhere from 1% to 4%. That spread isn’t a mistake. It comes from different datasets, different definitions, and different kinds of stores.
Here is the short version. In Littledata’s October 2026 benchmark of 426 Shopify stores, the median conversion rate is 1.4%, and stores above 2.7% sit in the top 20%. Searches for the “average conversion rate Shopify website 2025” still surface older numbers, so this guide uses the latest data and explains where the figures differ. You’ll learn what counts as good for your store, how to calculate your own rate, and how to improve it using your store data.
What is the average Shopify conversion rate?
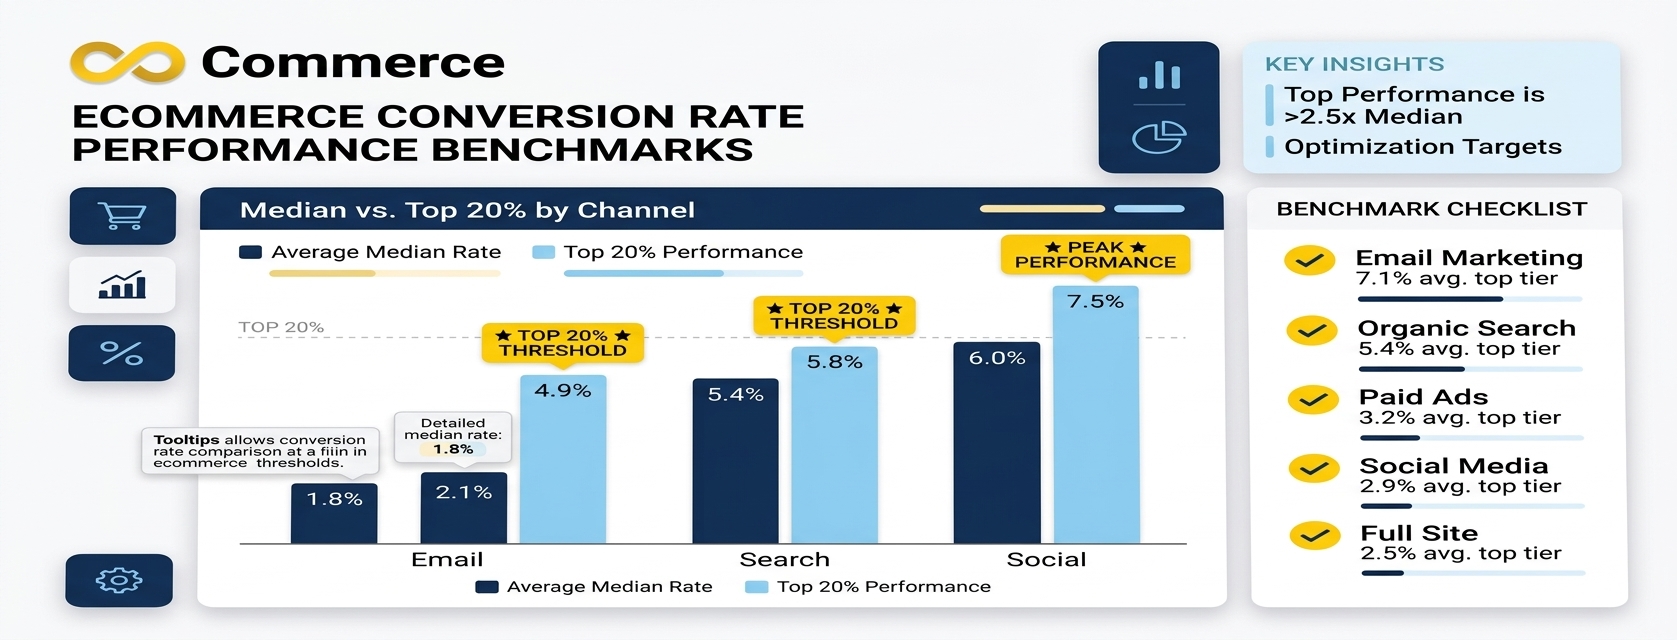
Conversion rate is the share of store sessions that end in a purchase. Shopify’s own analytics definition is sessions that completed checkout divided by total sessions.
Littledata’s benchmark covers 426 Shopify stores over the 90 days from July 6 to October 3, 2026. Here is how those stores spread out:
| Position | Conversion rate |
| Bottom 10% | 0.3% |
| Bottom 20% | 0.5% |
| Median | 1.4% |
| Top 20% | 2.7% |
| Top 10% | 3.5% |
The mean is 1.9%, higher than the median because a minority of stores convert far above the rest. The median is the more honest “typical” figure: half of stores are above it and half below.
Why you’ll see different numbers elsewhere
Other widely cited sources sit higher. A roundup from Propel Commerce lists figures from about 1.6% to nearly 3%, depending on whether the data covers all ecommerce, enterprise clients, or Shopify stores only. Some older pages still quote 3.2% as the “top 20%” mark, which comes from an earlier, larger dataset.
Two more reasons figures disagree:
- Who is in the sample. Littledata only includes stores with at least 1,000 sessions and 90 purchases in the 90-day window, using Google Analytics 4 data. Very new or low-traffic stores aren’t represented, so your own early numbers may sit lower.
- How it’s measured. GA4 sessions, Shopify sessions and ad-platform conversions don’t match exactly. Compare like with like.
Average Shopify conversion rate by industry
Your category matters more than the overall average. Littledata’s published industry medians:
| Industry | Median | Top 20% |
| Beauty & Skincare | 2.8% | 4.1% |
| Health & Supplements | 2.5% | 3.9% |
| Food & Beverage | 2.3% | 3.4% |
| Fashion & Apparel | 1.3% | 2.2% |
| Home & Furniture | 0.9% | 1.7% |
Each of these groups has only 31 to 75 stores, and Littledata publishes a group only once it has at least 30. Treat them as a guide, not a verdict. A furniture store at 1.7% is doing very well for its category, even though that number would look ordinary in beauty.
Mobile vs desktop conversion rate
Many articles claim mobile converts at half the desktop rate. Littledata’s current data tells a more interesting story:
| Metric | Mobile | Desktop |
| Median conversion rate | 1.5% | 1.5% |
| Top 20% | 2.9% | 3.2% |
| Top 10% | 4.0% | 5.3% |
| Median add-to-cart rate | 5.4% | 9.9% |
| Median checkout completion rate | 62% | 39% |
One reading, not a certainty: on mobile, shoppers appear to be lost before the cart, because add-to-cart is much lower, while those who reach checkout complete it often. If that fits your store, product pages and browsing on phones deserve attention before checkout does. Check your own device split rather than trusting any single benchmark.
Is your conversion rate good?
Use a simple test:
- Compare with the right group. Use your industry median, not the all-store figure.
- Compare the same device and traffic source. A store with mostly cold social traffic will convert lower than one with mostly returning customers.
- Look at the trend. A rate moving up month on month tells you more than one snapshot.
As a rough map of the all-store data: below 0.5% is in the bottom 20%, around 1.4% is typical, above 2.7% is strong, and above 3.5% is excellent. Rates also depend on store age, price point and how much of your traffic is new.
How to calculate your Shopify conversion rate
Formula: sessions that completed checkout ÷ total sessions × 100
If your store had 20,000 sessions last month and 300 sessions completed checkout, your conversion rate is 300 ÷ 20,000 = 1.5%.
Practical notes for getting a clean number:
- Use your Shopify analytics reports for the baseline. They show sessions, sessions with cart additions, sessions that reached checkout, and sessions that completed checkout.
- Sessions are not orders. One session can place one order at most for this metric, and an order count can differ from completed-checkout sessions.
- Keep test orders out of the picture. Shopify says test orders and simulated transactions don’t appear in reports.
- Pick a window long enough to be stable. Weekly rates swing. Use at least a few weeks, and compare the same period year on year if you can.
- Watch for bot traffic and tracking gaps. Fake sessions drag the rate down, and missing purchase events make it look worse than it is. If numbers differ between tools, work out why before you change anything on your store.
Find where you lose shoppers: read the funnel
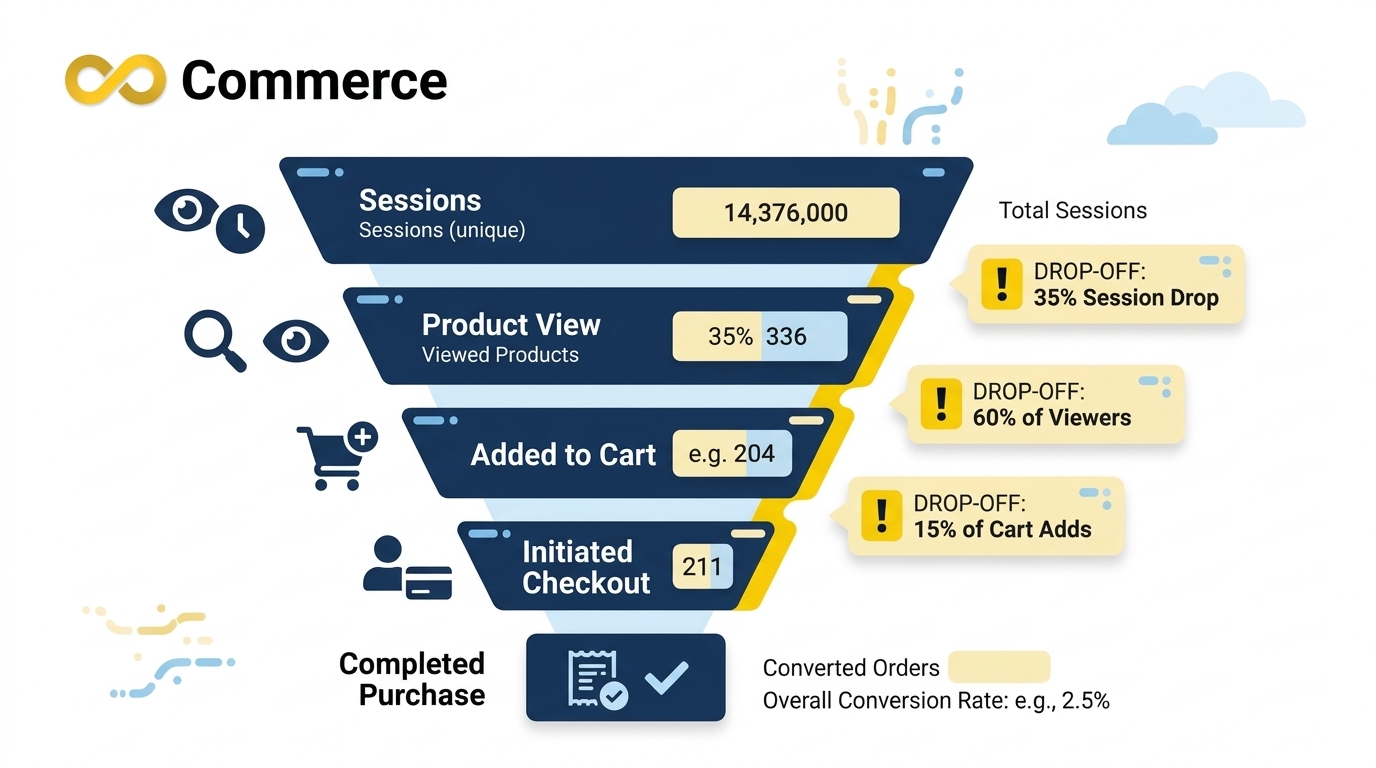
A single conversion rate tells you how well the store converts, not why it doesn’t. Break it into stages. Shopify reports four sessions-based steps: all sessions, sessions with cart additions, sessions that reached checkout, and sessions that completed checkout.
Littledata publishes benchmarks for two of those steps:
| Stage | Median | Top 20% |
| Add-to-cart rate | 6.8% | above 12% |
| Checkout completion rate | 52% | above 68% |
Compare each stage with your own numbers, then match the weak one to a fix:
| If this stage is weak | Look at |
| Visitors don’t add to cart | Product pages, pricing, images, page speed, traffic quality |
| They add to cart but don’t start checkout | Cart page, shipping cost visibility, trust signals |
| They start checkout but don’t finish | Checkout friction, payment options, surprise fees |
Numbers show where the leak is. They don’t show what the shopper experienced. That’s where behavior data helps. The Infinite Microsoft Clarity & Heatmap app offers session replays and click and scroll heatmaps, with filters to segment visitors by device. Watch a handful of sessions that reached the cart and left, and compare phone with desktop. Patterns show up quickly: buttons nobody sees, taps that don’t respond, or a page abandoned at the same point.
How to beat the average: 7 practical improvements
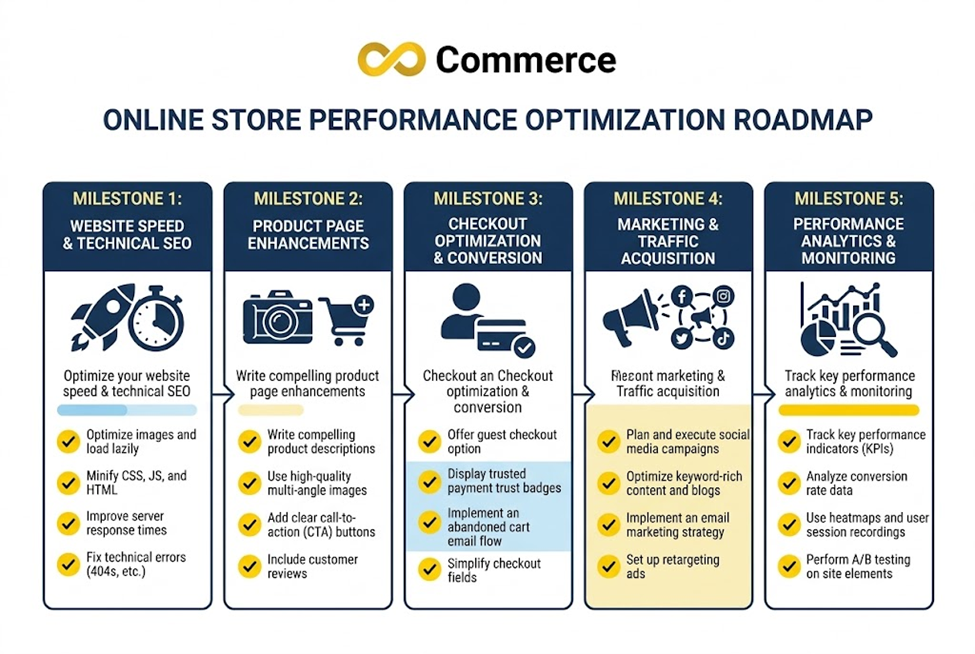
None of these guarantees a lift. Treat each as a hypothesis to test against your own data.
1. Fix measurement first
Before optimizing, confirm that your purchase and add-to-cart events fire correctly and aren’t duplicated. If your Facebook Pixel events are missing or misfiring, our guide to fixing a Facebook Pixel that is not working on Shopify is a good place to start. A conversion rate built on faulty tracking sends you after the wrong problem.
- Make your store fast on phones
Slow pages lose shoppers before they see a product. Check Shopify’s web performance reports, which rate your Core Web Vitals from real visitor data. Google’s good thresholds are an LCP of 2.5 seconds or less, INP of 200 milliseconds or less, and CLS of 0.1 or less. One common culprit: lazy-loading the main hero image, which Shopify advises against.
3. Make buttons easy to tap
Google’s tap target guidance recommends targets of about 48 by 48 pixels with roughly 8 pixels between them. Check quantity buttons, variant swatches, filters and close buttons on phones.
4. Answer questions on the product page
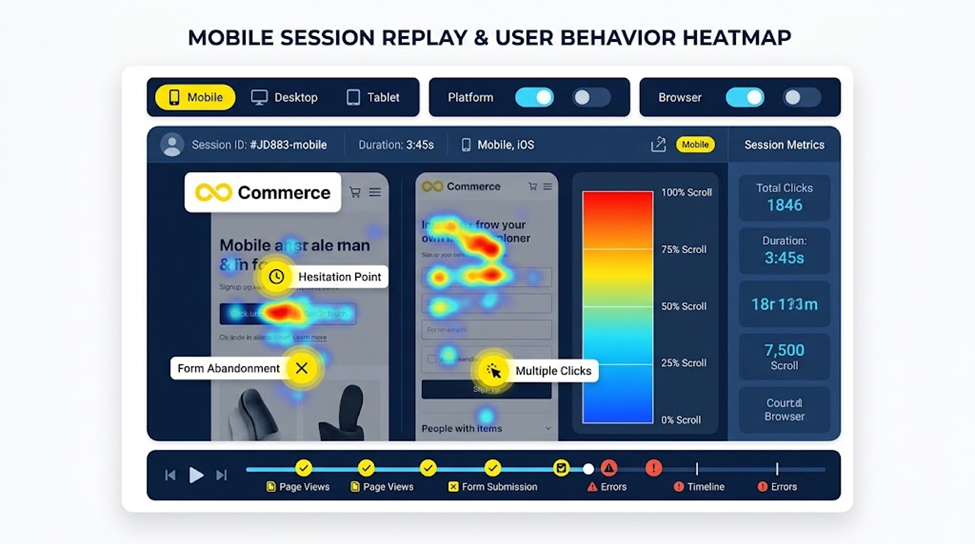
Shoppers hesitate when they can’t picture the product or don’t know the delivery cost and return terms. Review each product page for clear photos, accurate size or spec information, shipping and returns details, and customer reviews if you have them. Use heatmaps and replays to see what shoppers scroll past or click on, then test changes.
5. Cut checkout friction
Turn on accelerated checkouts such as Shop Pay, Apple Pay and Google Pay, which let returning customers pay with saved details. Then review your checkout form options: fields can be required, optional or hidden, so only ask for what your provider and carrier need. Show shipping costs early so the total never surprises anyone.
6. Match traffic to the page
A great page can still convert badly if the traffic doesn’t fit. Segment your conversion rate by source, campaign and landing page. If one channel brings plenty of visits and almost no sales, fix the message match or reconsider the spend, instead of redesigning the whole store.
7. Follow up on abandoned carts and checkouts
Many visitors leave with items in the cart. Recovery emails or messages sent to shoppers who gave you contact details can bring some back. Keep them helpful, not pushy, and make sure they link straight to the saved cart.
Test one change at a time
Make a single change, give it enough traffic to read, and compare against the same weeks before. If you change five things at once, you won’t know which worked. Small stores with low traffic may need longer test windows.
The upside of a small improvement
Here’s why modest gains matter. Revenue is roughly sessions × conversion rate × average order value. With illustrative numbers, 20,000 sessions at a 1.5% rate and a $60 average order gives about $18,000. Lift the rate to 1.8% with the same traffic and order value, and that becomes about $21,600. That’s a 20% increase without buying a single extra visitor. These figures are an example, not a forecast.
Conclusion
The average Shopify conversion rate in 2026 is closer to 1.4% than the 2% to 3% that older articles quote, and what counts as “good” depends on your industry, device mix and traffic. Don’t chase someone else’s number. Calculate your own cleanly, find the weakest stage of your funnel, and test one improvement at a time.
To see why shoppers hesitate, not just how many do, try the Infinite Microsoft Clarity & Heatmap app. Review session replays and heatmaps for mobile and desktop visitors, and let what you see guide your next test.
FAQs
Littledata’s October 2026 benchmark of 426 Shopify stores puts the median at 1.4%, with the top 20% above 2.7%. Other sources report higher figures because they use different datasets and definitions.
Above the median for your industry is solid. Across the all-store data, above 2.7% puts a store in the top 20%, and above 3.5% in the top 10%. Below 0.5% is in the bottom 20%.
Yes, it’s above the 1.4% median in this benchmark, though still below the 2.7% top-20% mark. In beauty and skincare, where the median is 2.8%, 2% would be below average, so compare within your category.
Open the analytics reports in your Shopify admin and look at the conversion rate and the funnel steps. Shopify calculates it as sessions that completed checkout divided by sessions.
Not in Littledata’s current data, where both medians are 1.5%. The difference shows up at specific steps: mobile add-to-cart is lower, while checkout completion is higher. Check your own device split.
It depends on your traffic. Wait for enough sessions to compare like with like, and avoid judging a change on a few days of data.
